Getting Started with Splunk: Installation and SPL Basics for Security Monitoring
Welcome Back!
Splunk is one of the most widely used platforms for log aggregation, search, and security monitoring in modern environments. If you have ever reviewed system logs manually or investigated security events across multiple tools, Splunk serves a similar purpose but at scale. Instead of checking individual log files, Splunk centralizes data and allows you to search, correlate, and visualize events across systems in real time.
Splunk is commonly deployed in enterprise Security Operations Centers (SOCs), where it functions as a core component of security monitoring and incident detection. Its value extends well beyond large organizations. Splunk is also well suited for students, home-lab environments, and practitioners learning how security events are generated, collected, and analyzed.
Understanding how Splunk works provides foundational insight into how modern SIEM platforms operate. Many other security monitoring tools follow similar concepts, including centralized logging, structured searches, dashboards, and alerting. Learning Splunk helps build skills that transfer directly to other platforms and real-world environments.
This article begins a new series focused on using Splunk for security monitoring. In this first part, we focus on installing Splunk Enterprise and learning the fundamentals of Splunk Processing Language (SPL).
Method 1: Installing Splunk Enterprise on a Linux Lab Host
Splunk provides officially supported packages that can be installed locally for learning and testing. The free Splunk Enterprise license includes full search and dashboard functionality with a daily indexing limit, making it ideal for labs and demonstrations.
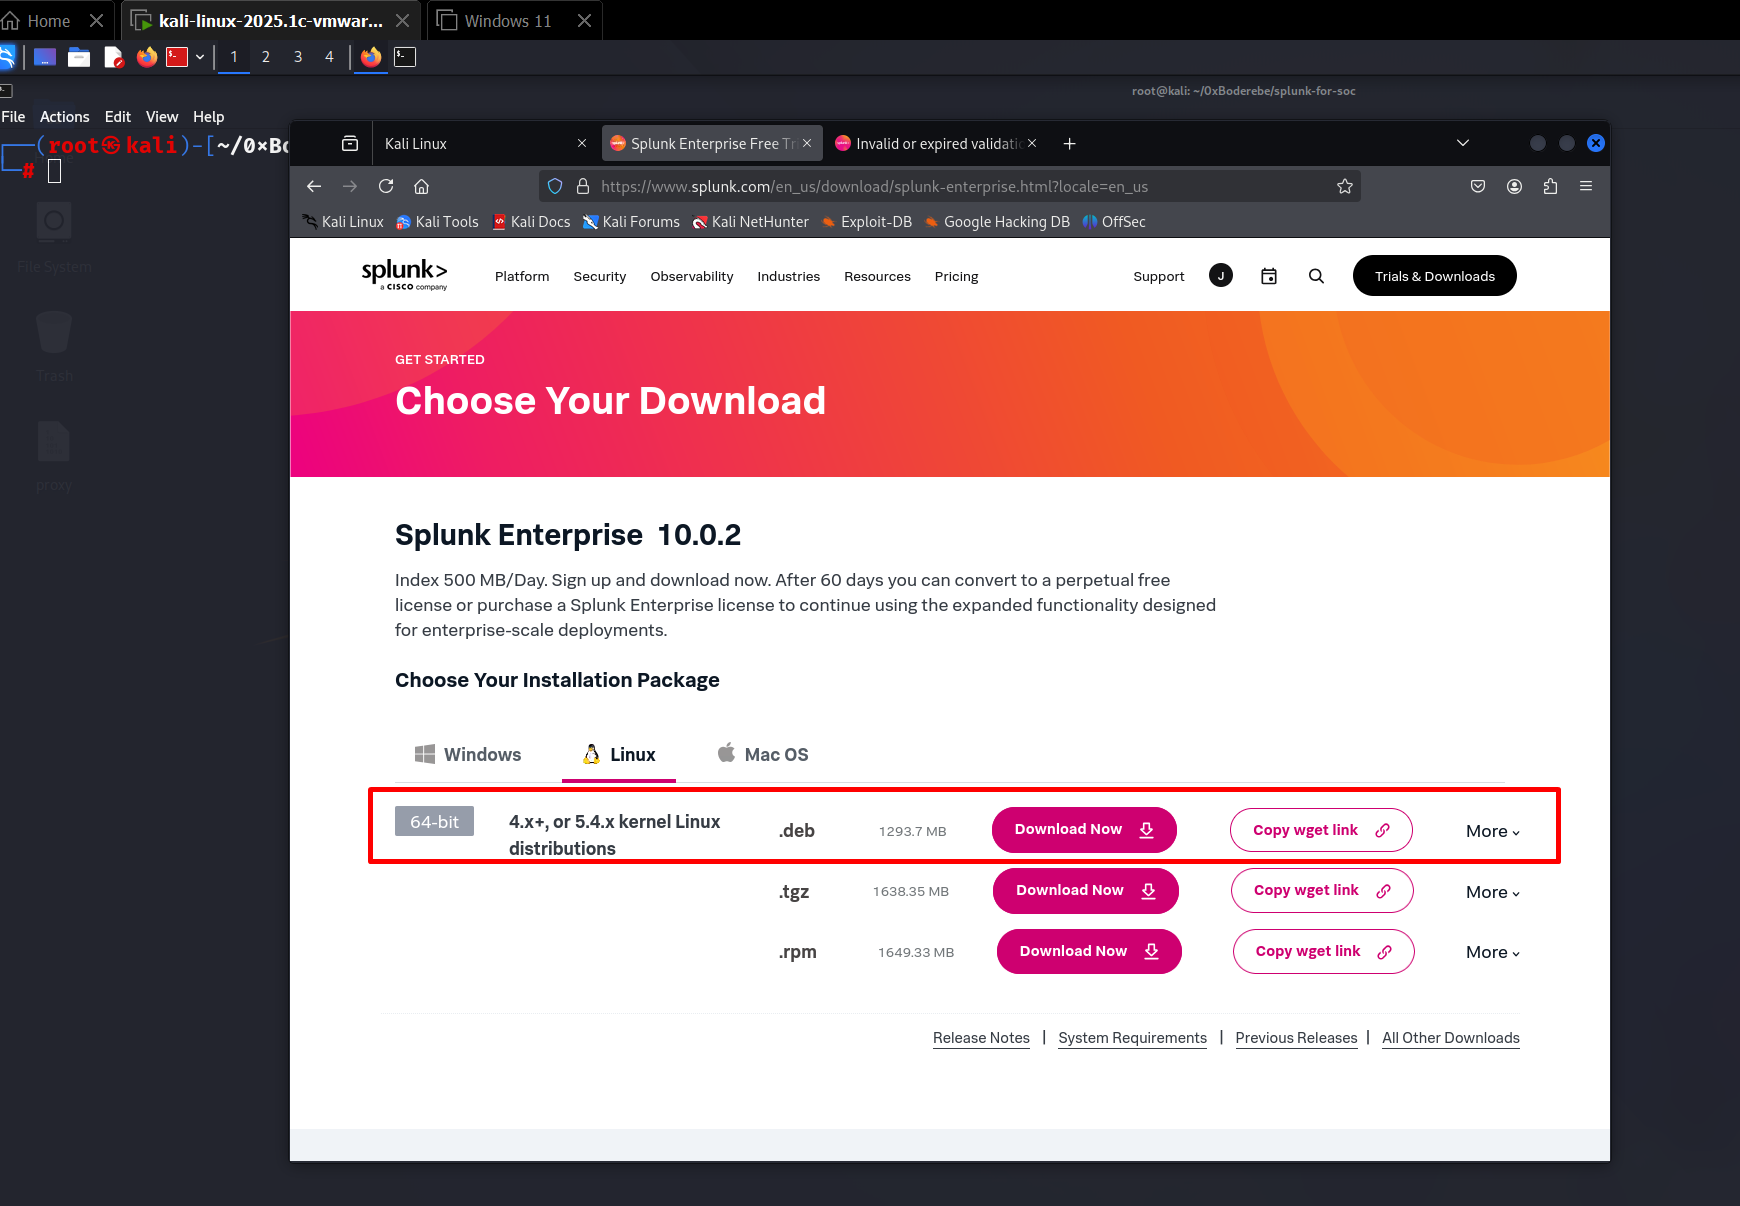
1. Download the Splunk package
Go to the official Splunk download page and sign up/log in with a free account:
Select Splunk Enterprise → Linux → Debian package (.deb for amd64/x86_64). Download via browser, then transfer the file to your Kali/lab host (for example, with scp or a shared folder).
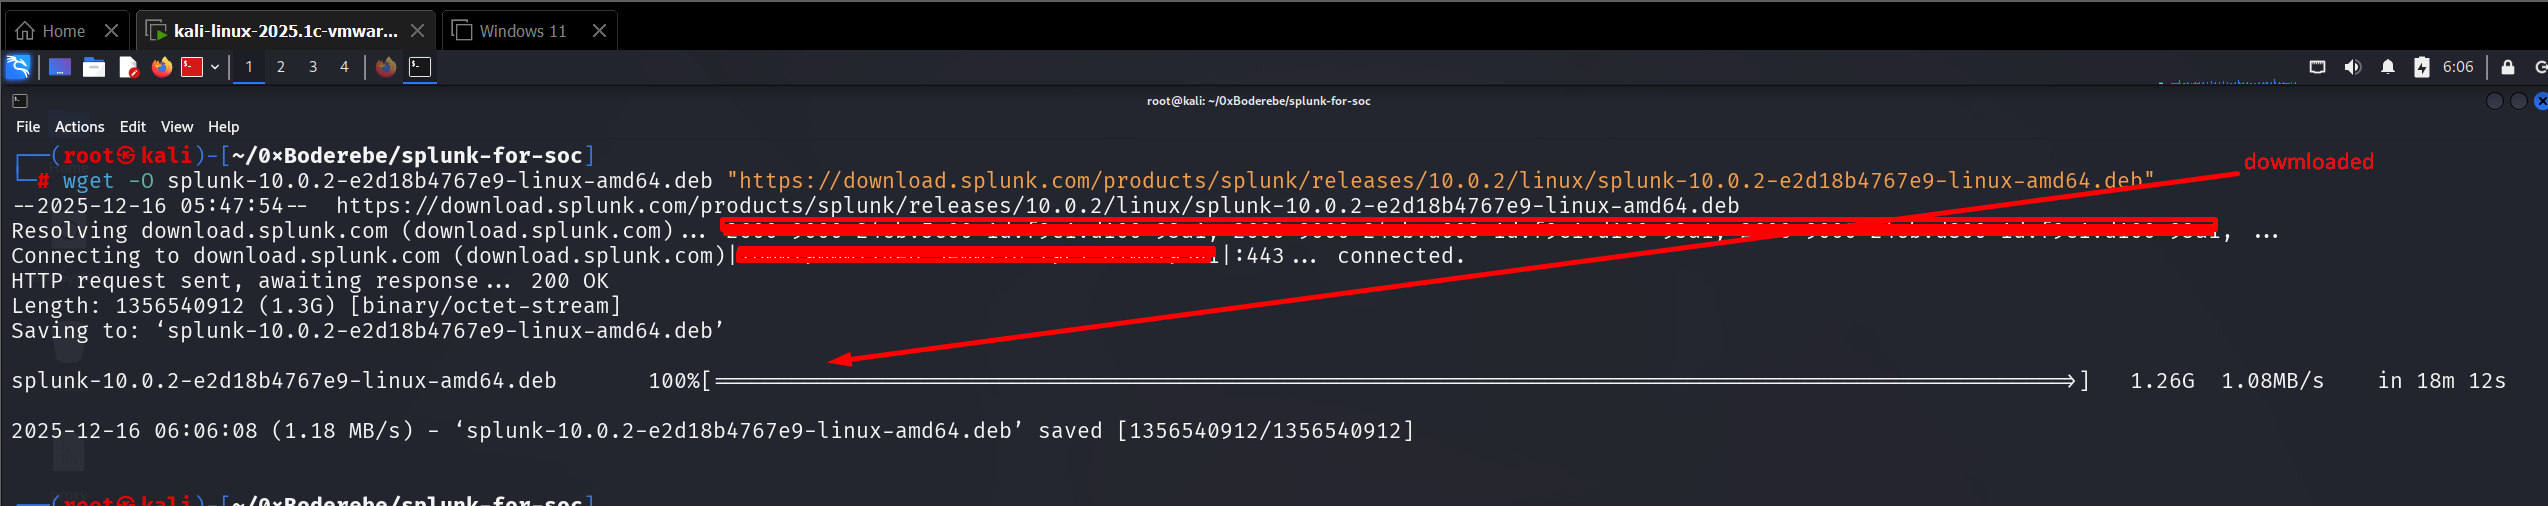
Direct wget links are gated behind the Splunk account and may not be reproducible. After you download the package in your browser, copy it to your lab host and install with a local wget command that points to the downloaded file. Example (replace the filename with the one you downloaded — current latest is 10.0.2 at the time of writing):
wget -O splunk-10.0.2-e2d18b4767e9-linux-amd64.deb "https://download.splunk.com/products/splunk/releases/10.0.2/linux/splunk-10.0.2-e2d18b4767e9-linux-amd64.deb"(Replace the filename above with the exact file you received from Splunk; the build-hash is unique per release.)
2. Install the Splunk package
Install Splunk using dpkg (Debian/Ubuntu) or follow the tarball instructions for other distributions.
sudo dpkg -i splunk-10.0.2-e2d18b4767e9-linux-amd64.deb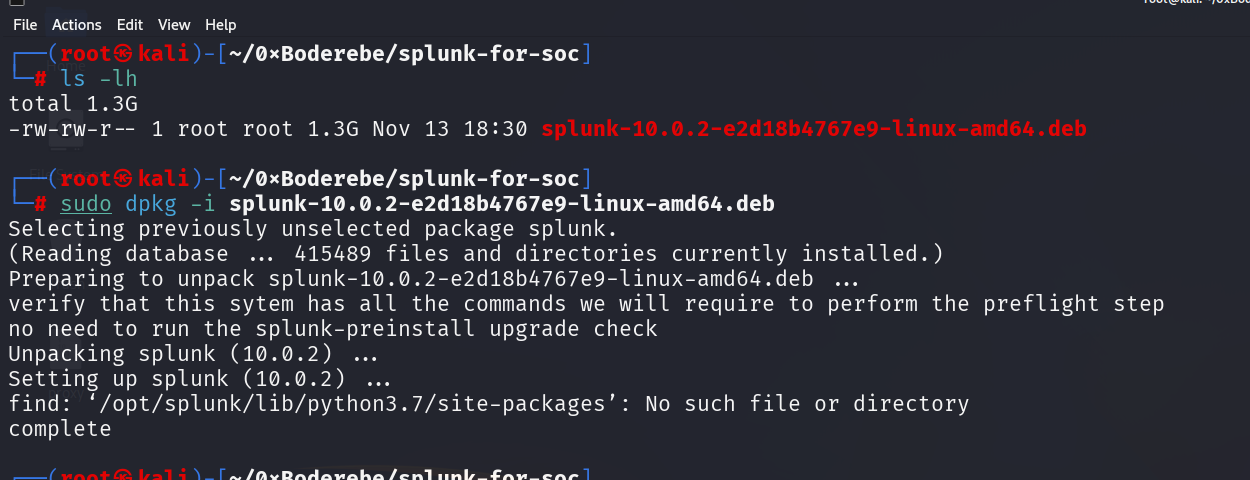
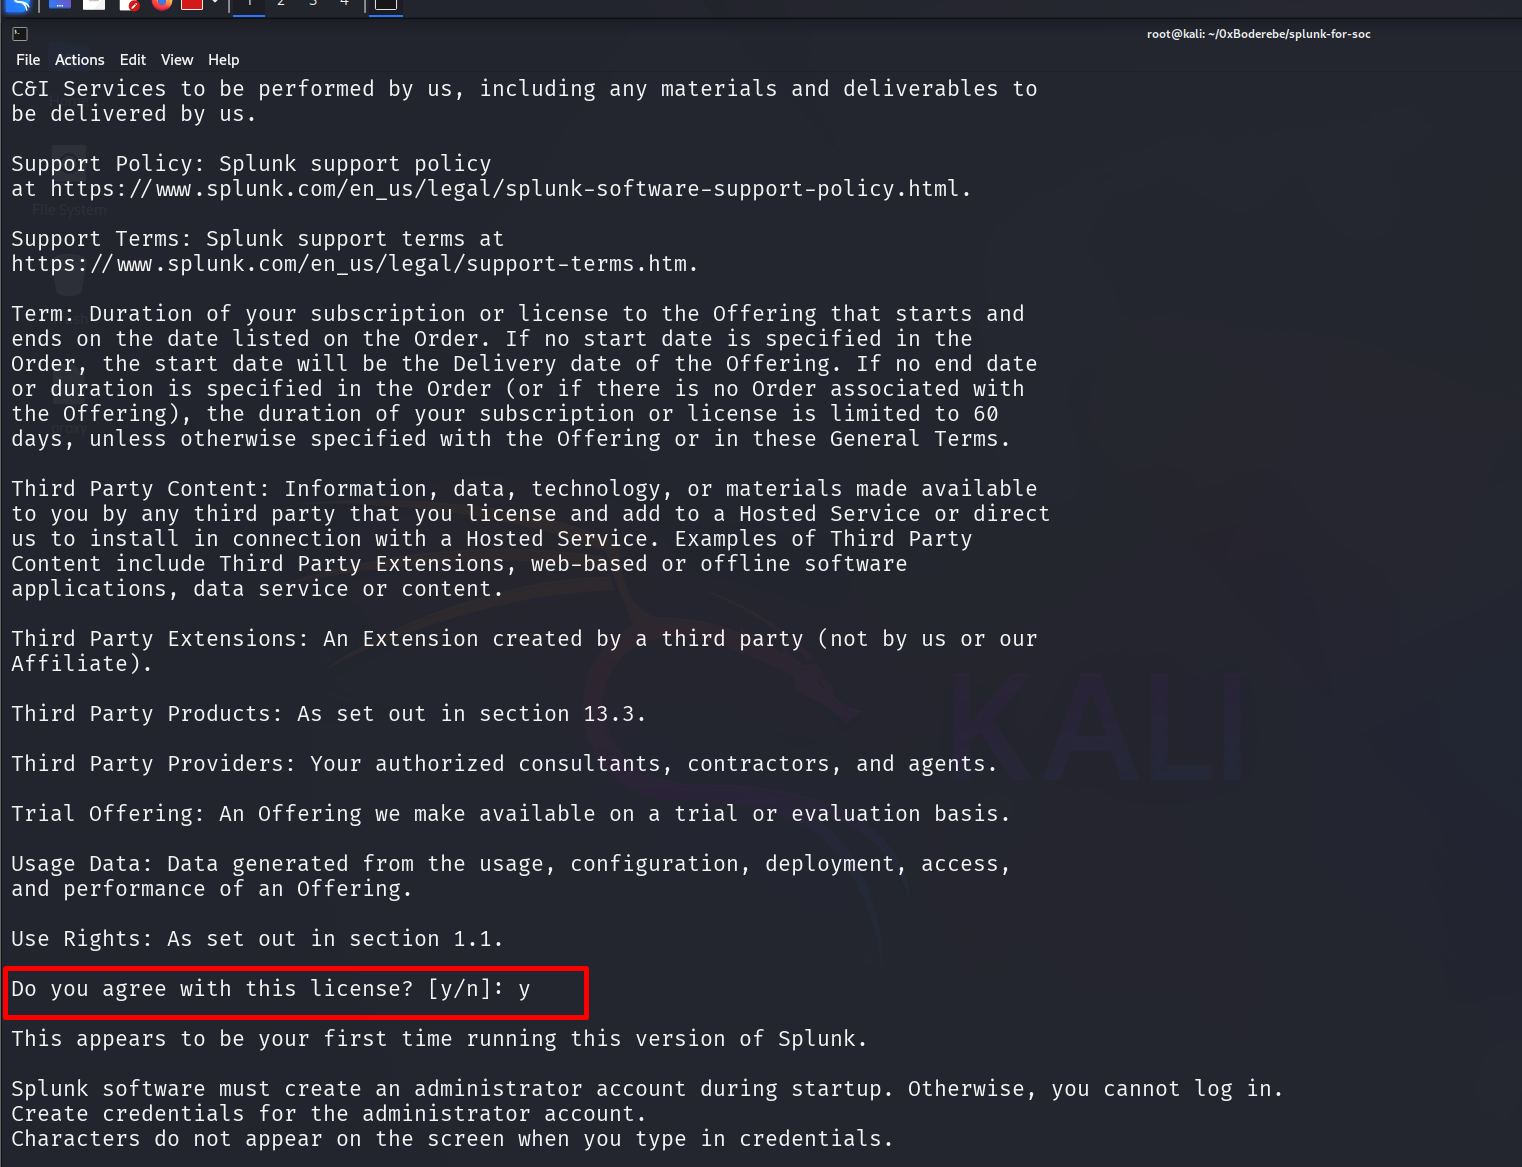
3. Start Splunk and accept the license
Start Splunk and accept the license on first run. You will be prompted to set an administrator username and password.
sudo /opt/splunk/bin/splunk start --accept-license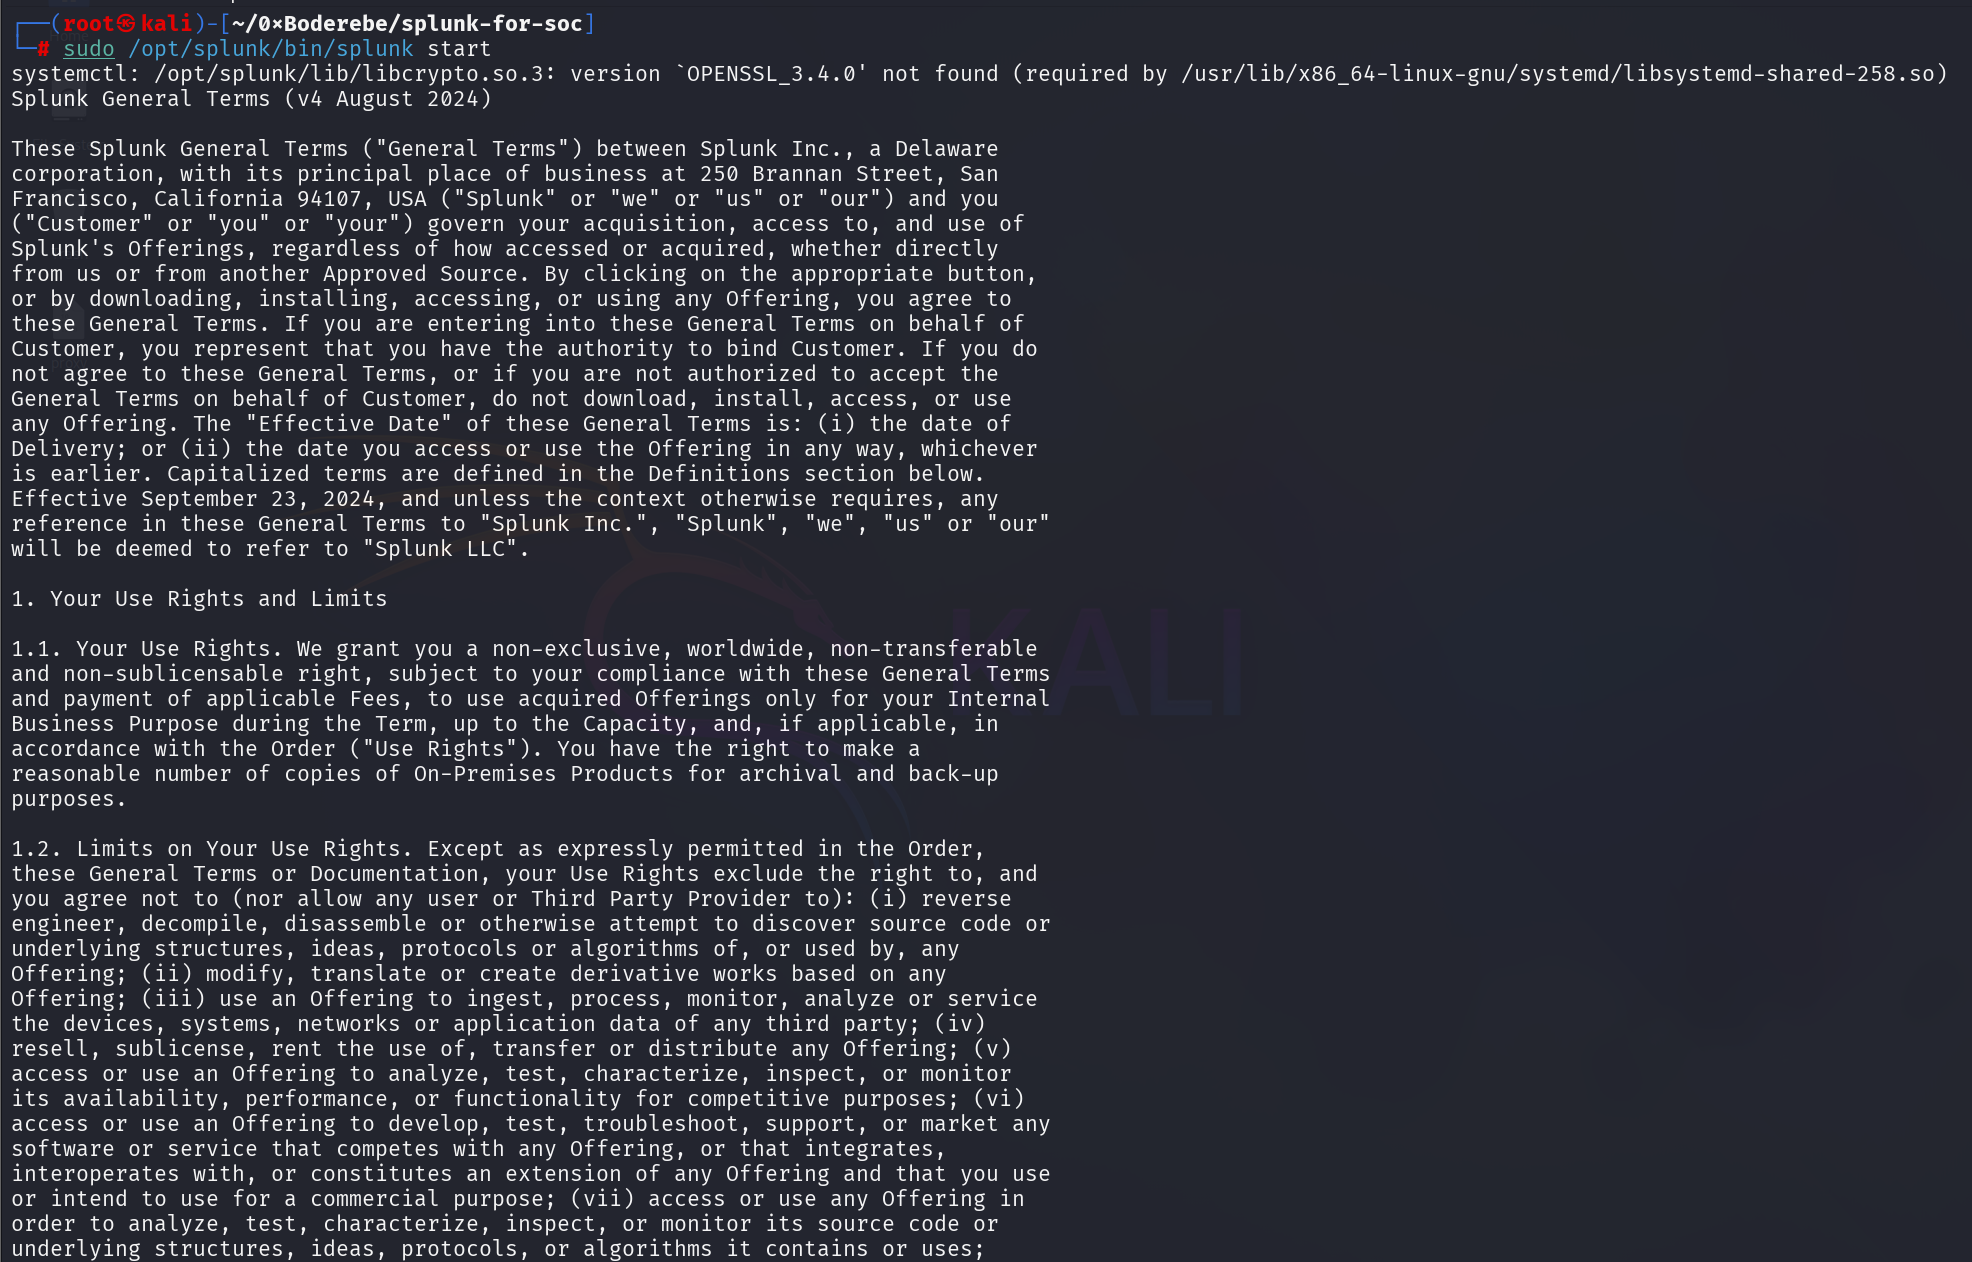
After the first start, enable Splunk to start at boot so it persists across reboots (helpful for lab hosts):
sudo /opt/splunk/bin/splunk enable boot-start
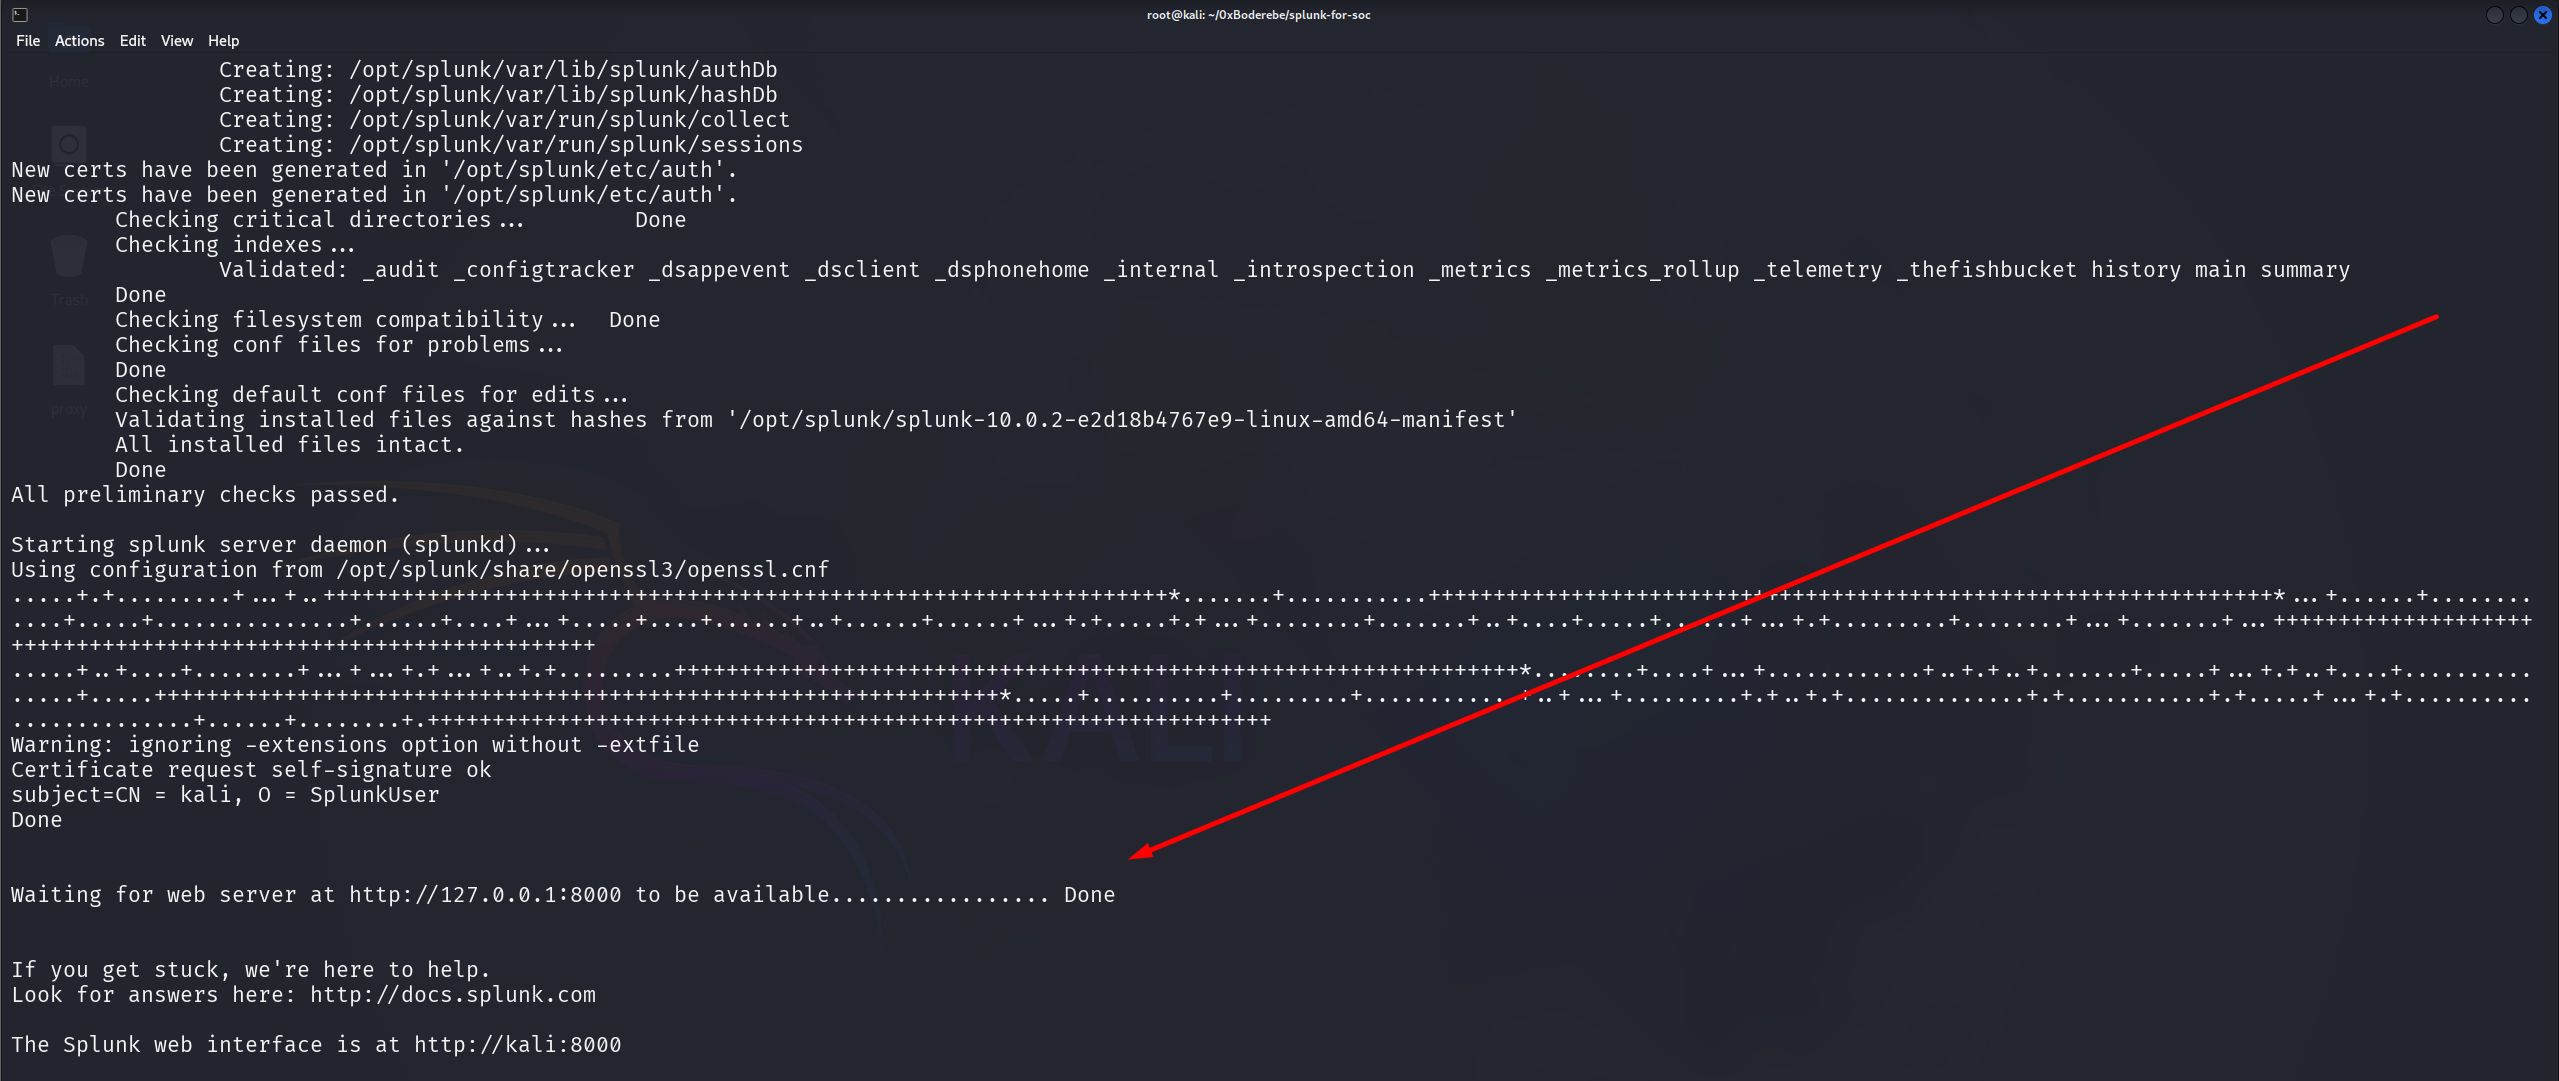
4. Access the Splunk web interface
Once running locally, open the Splunk web UI in your browser:
http://localhost:8000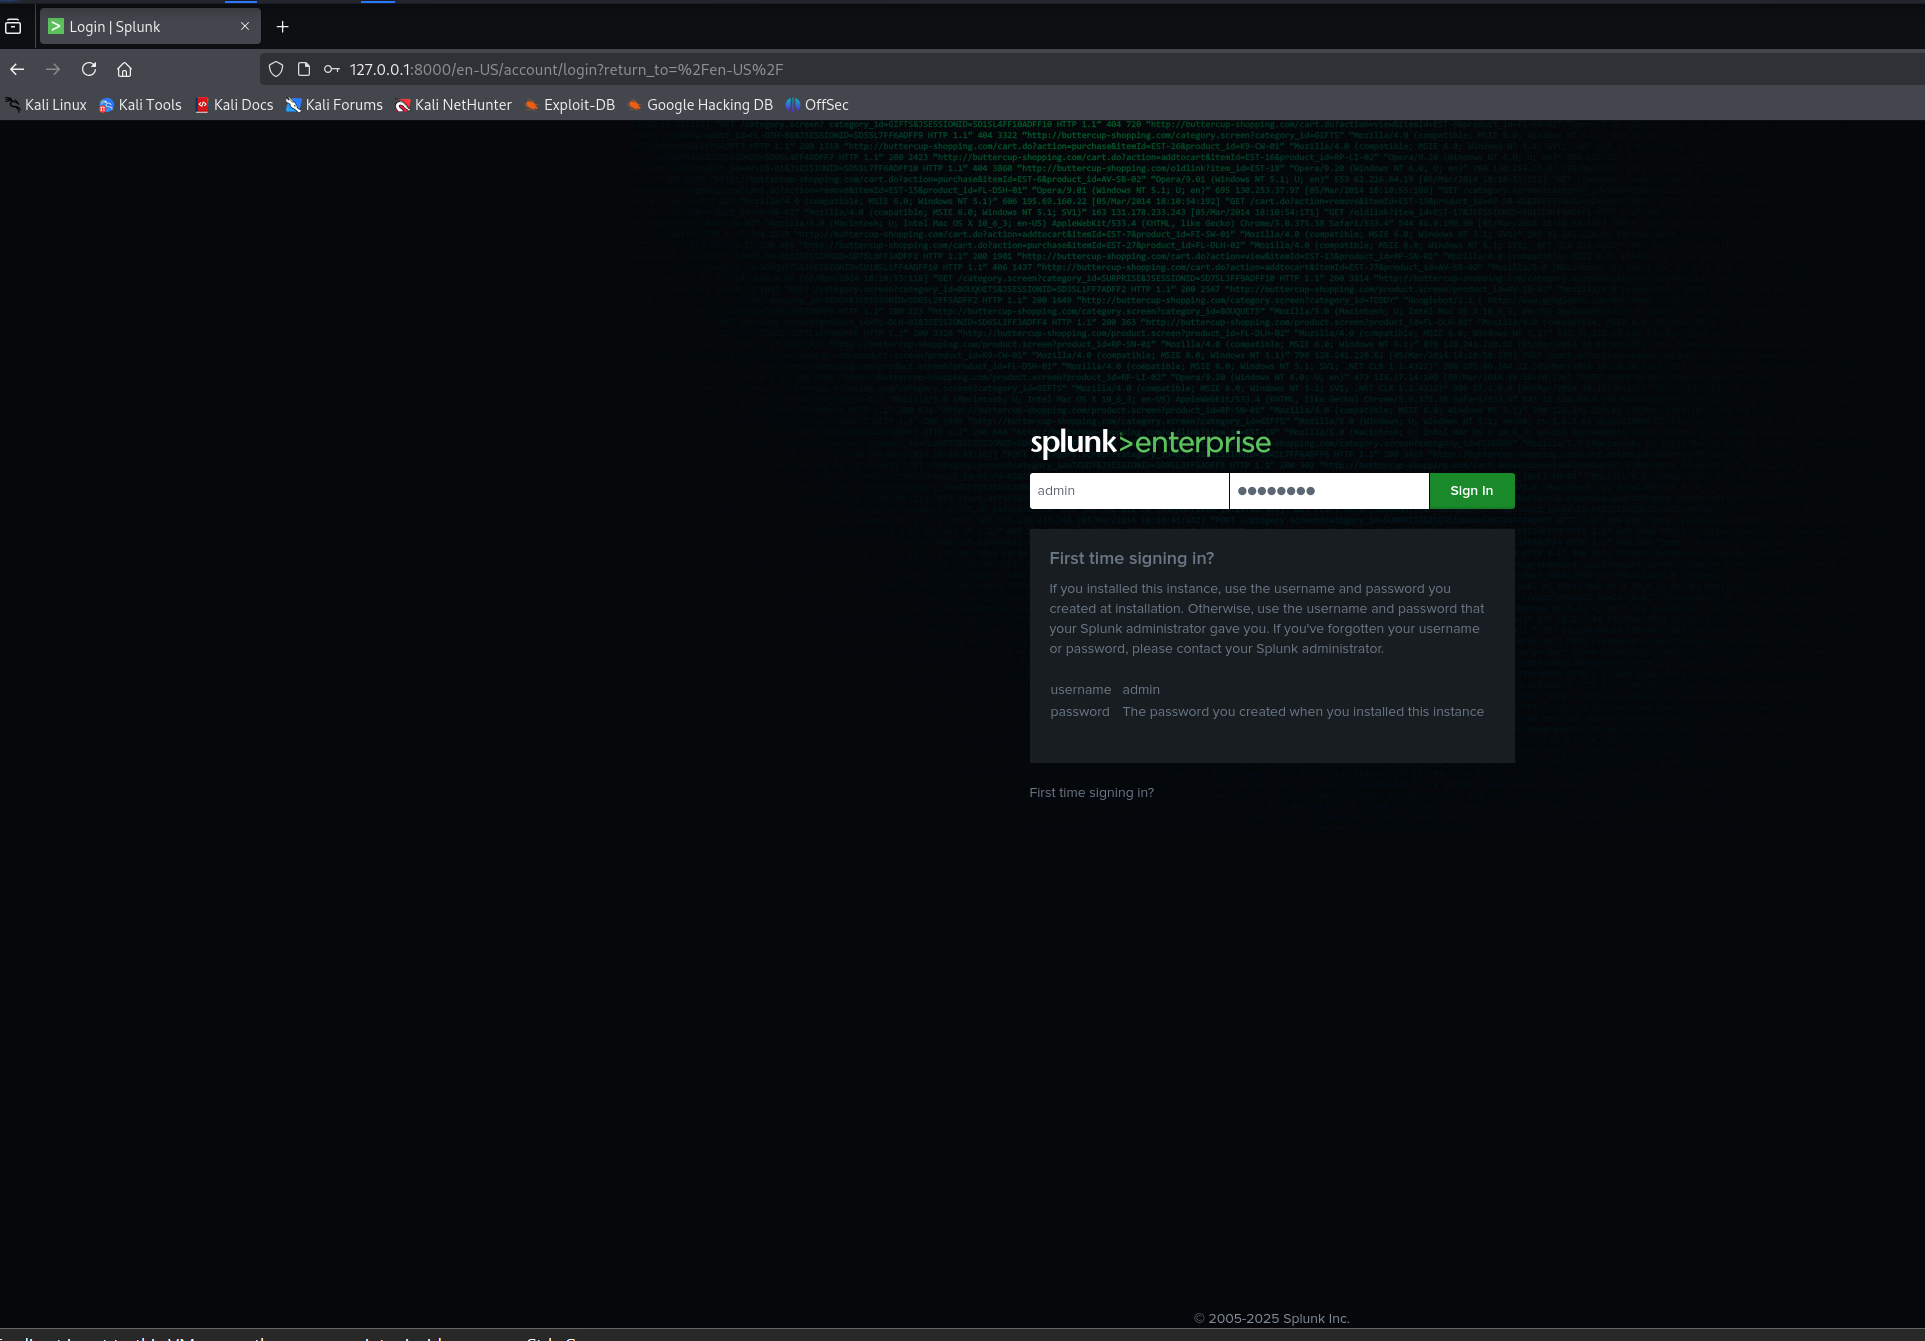
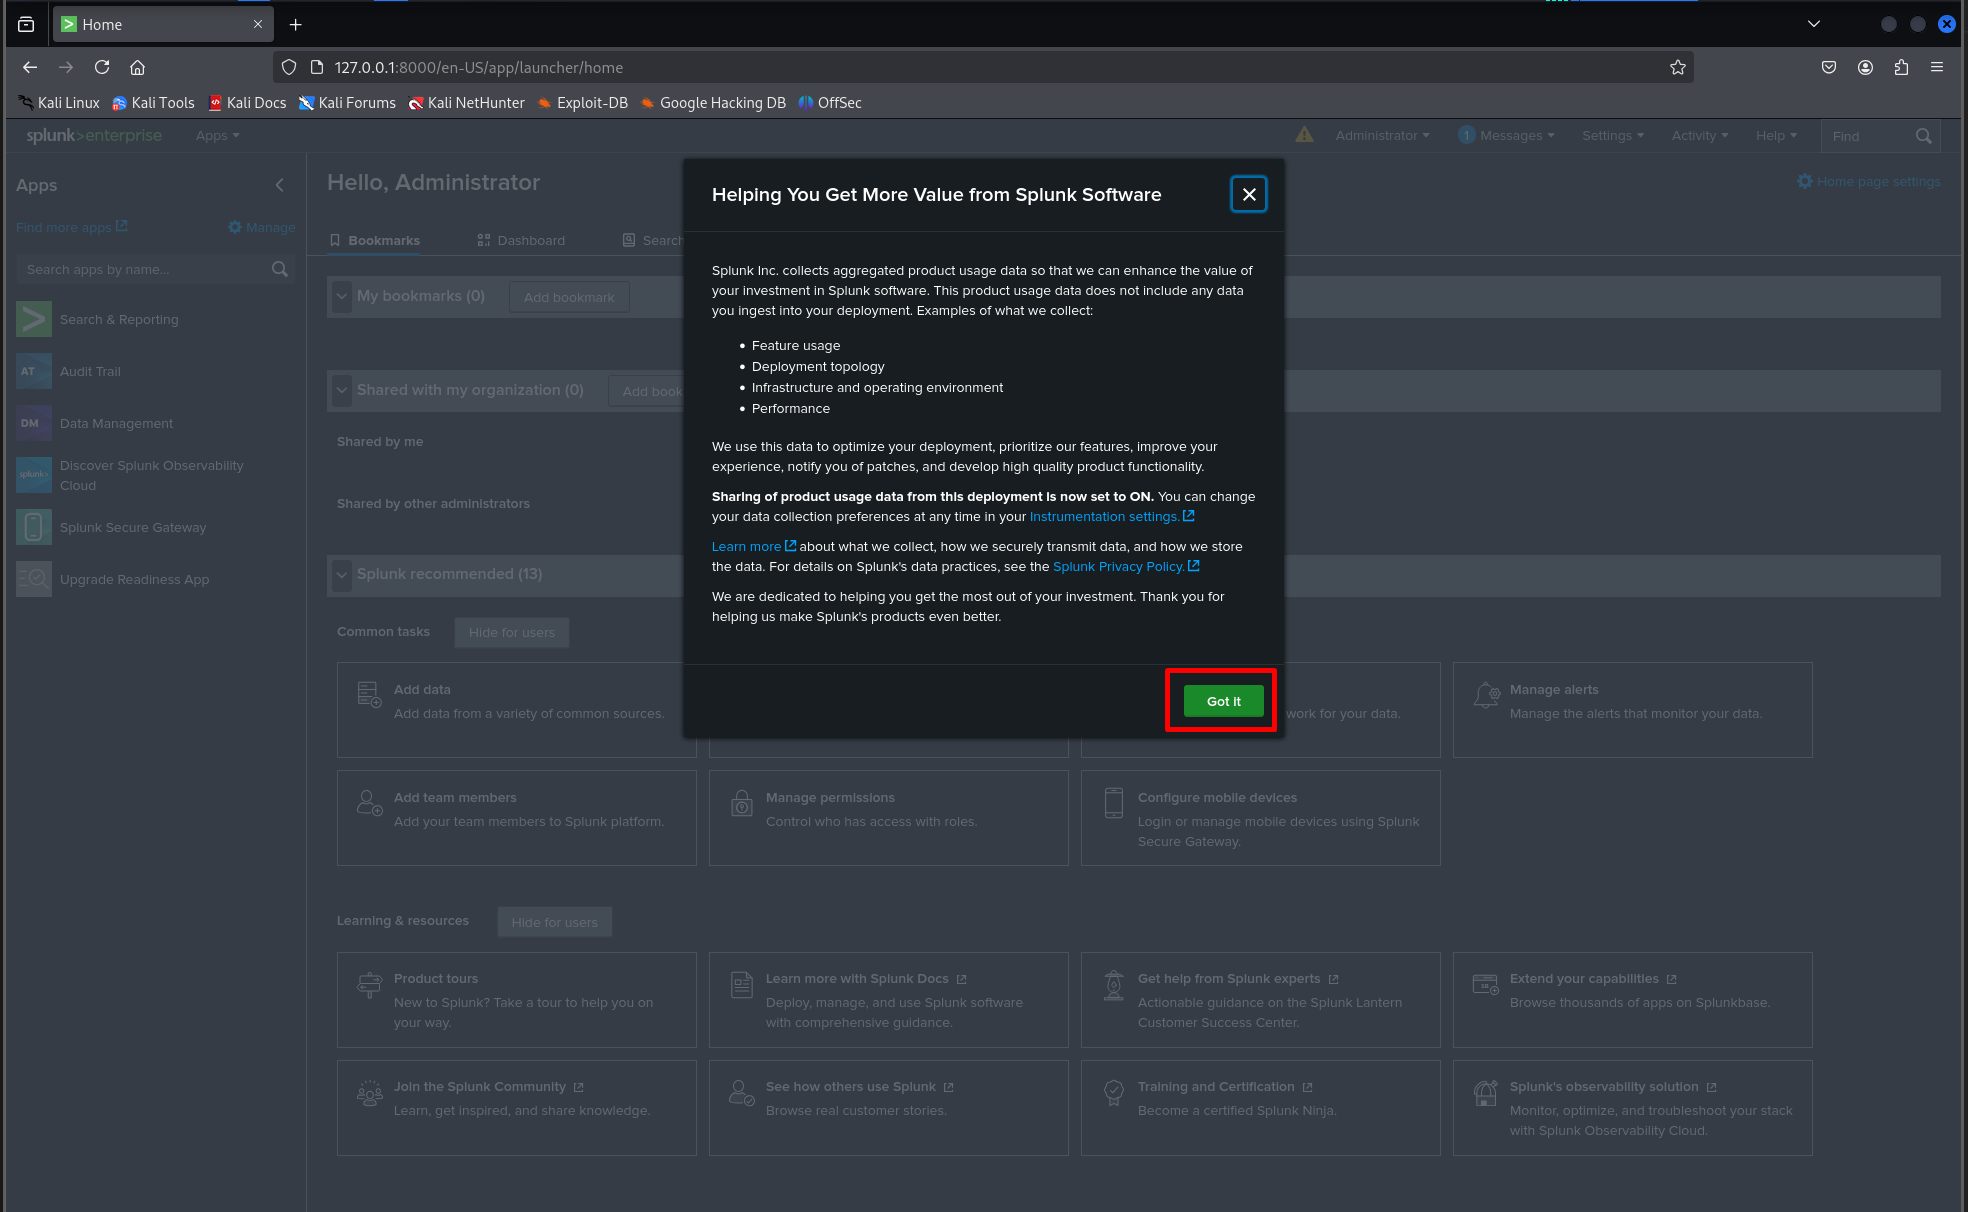
Method 2: Verifying Splunk Is Ready for Use
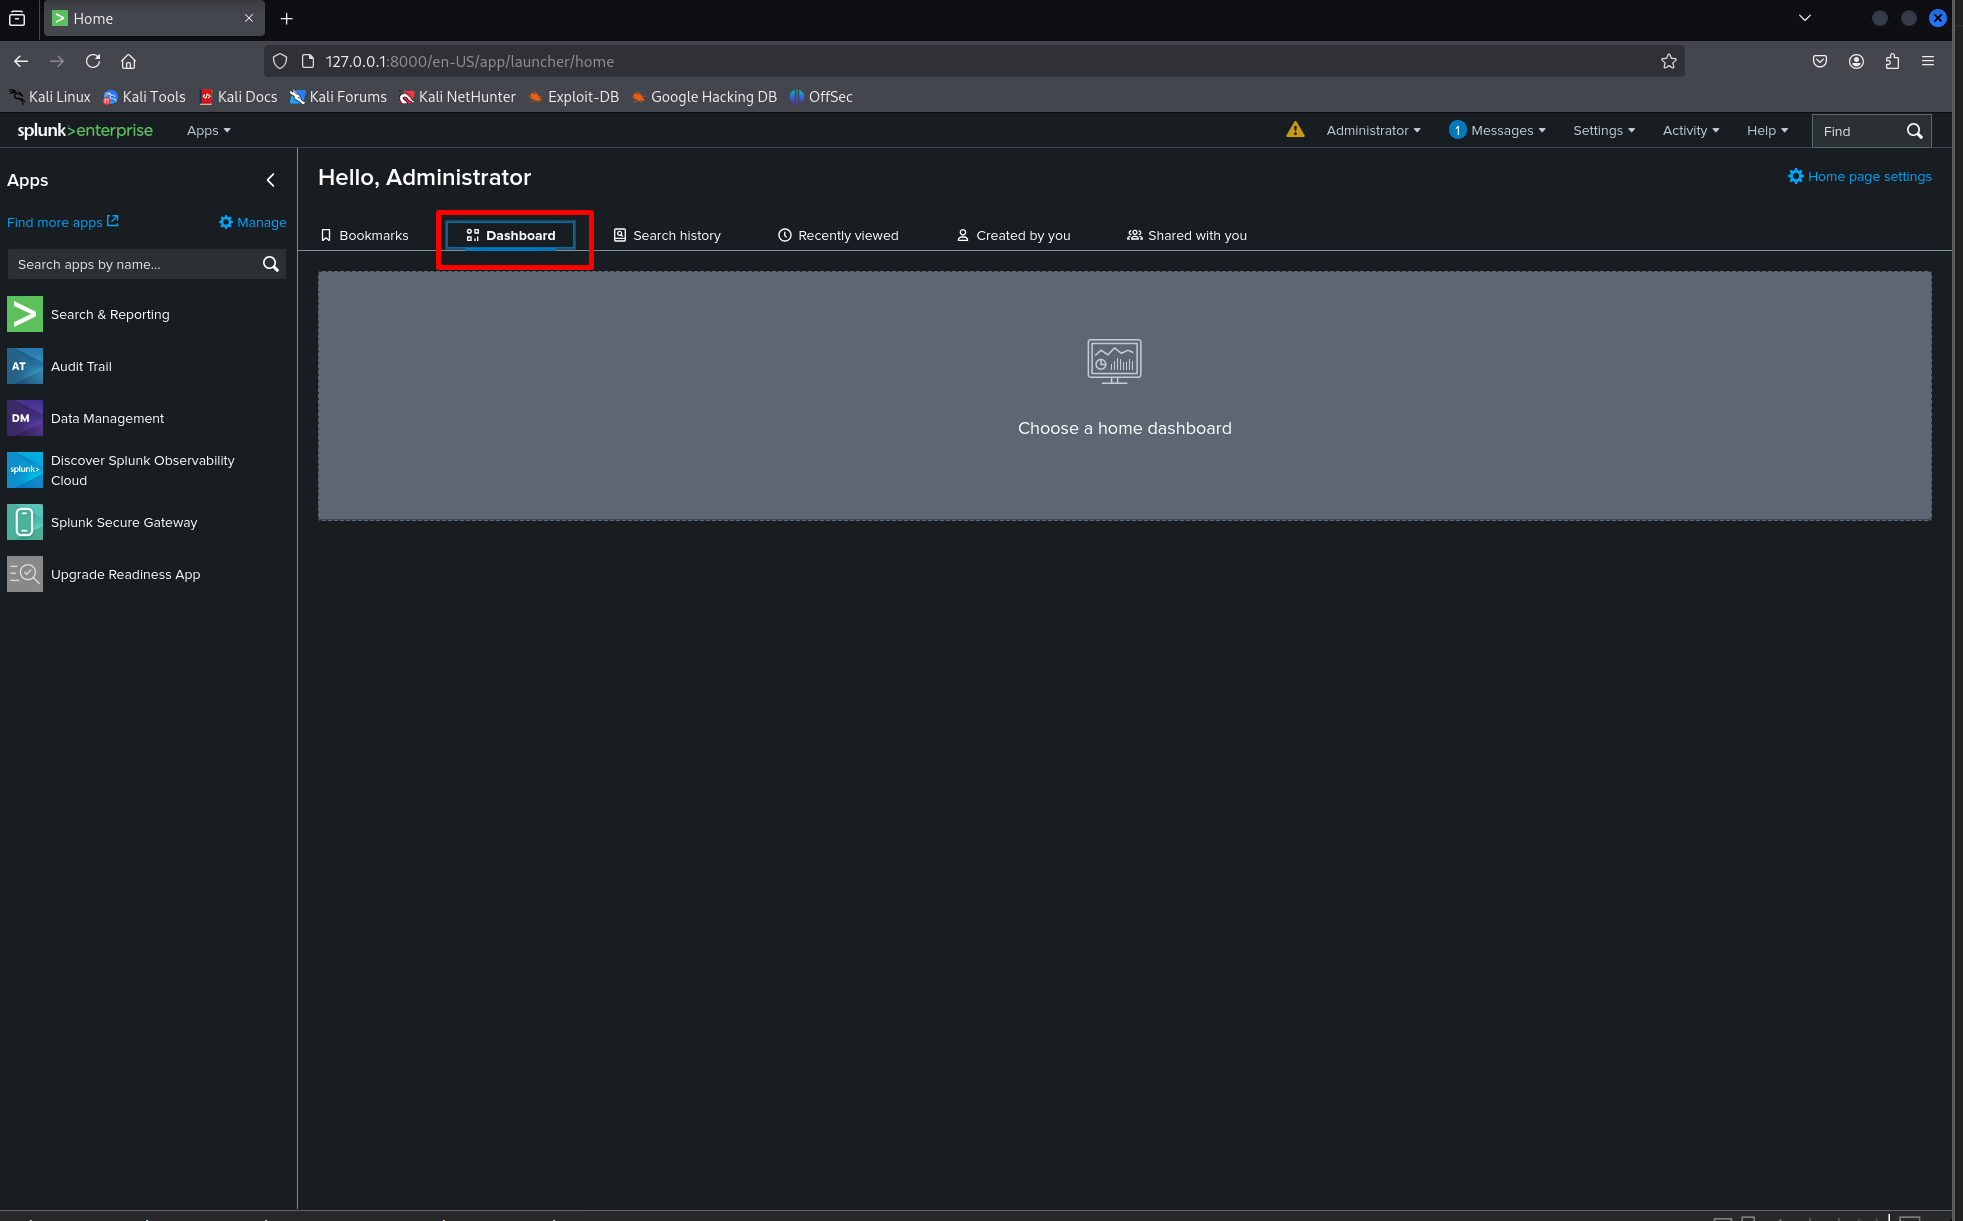
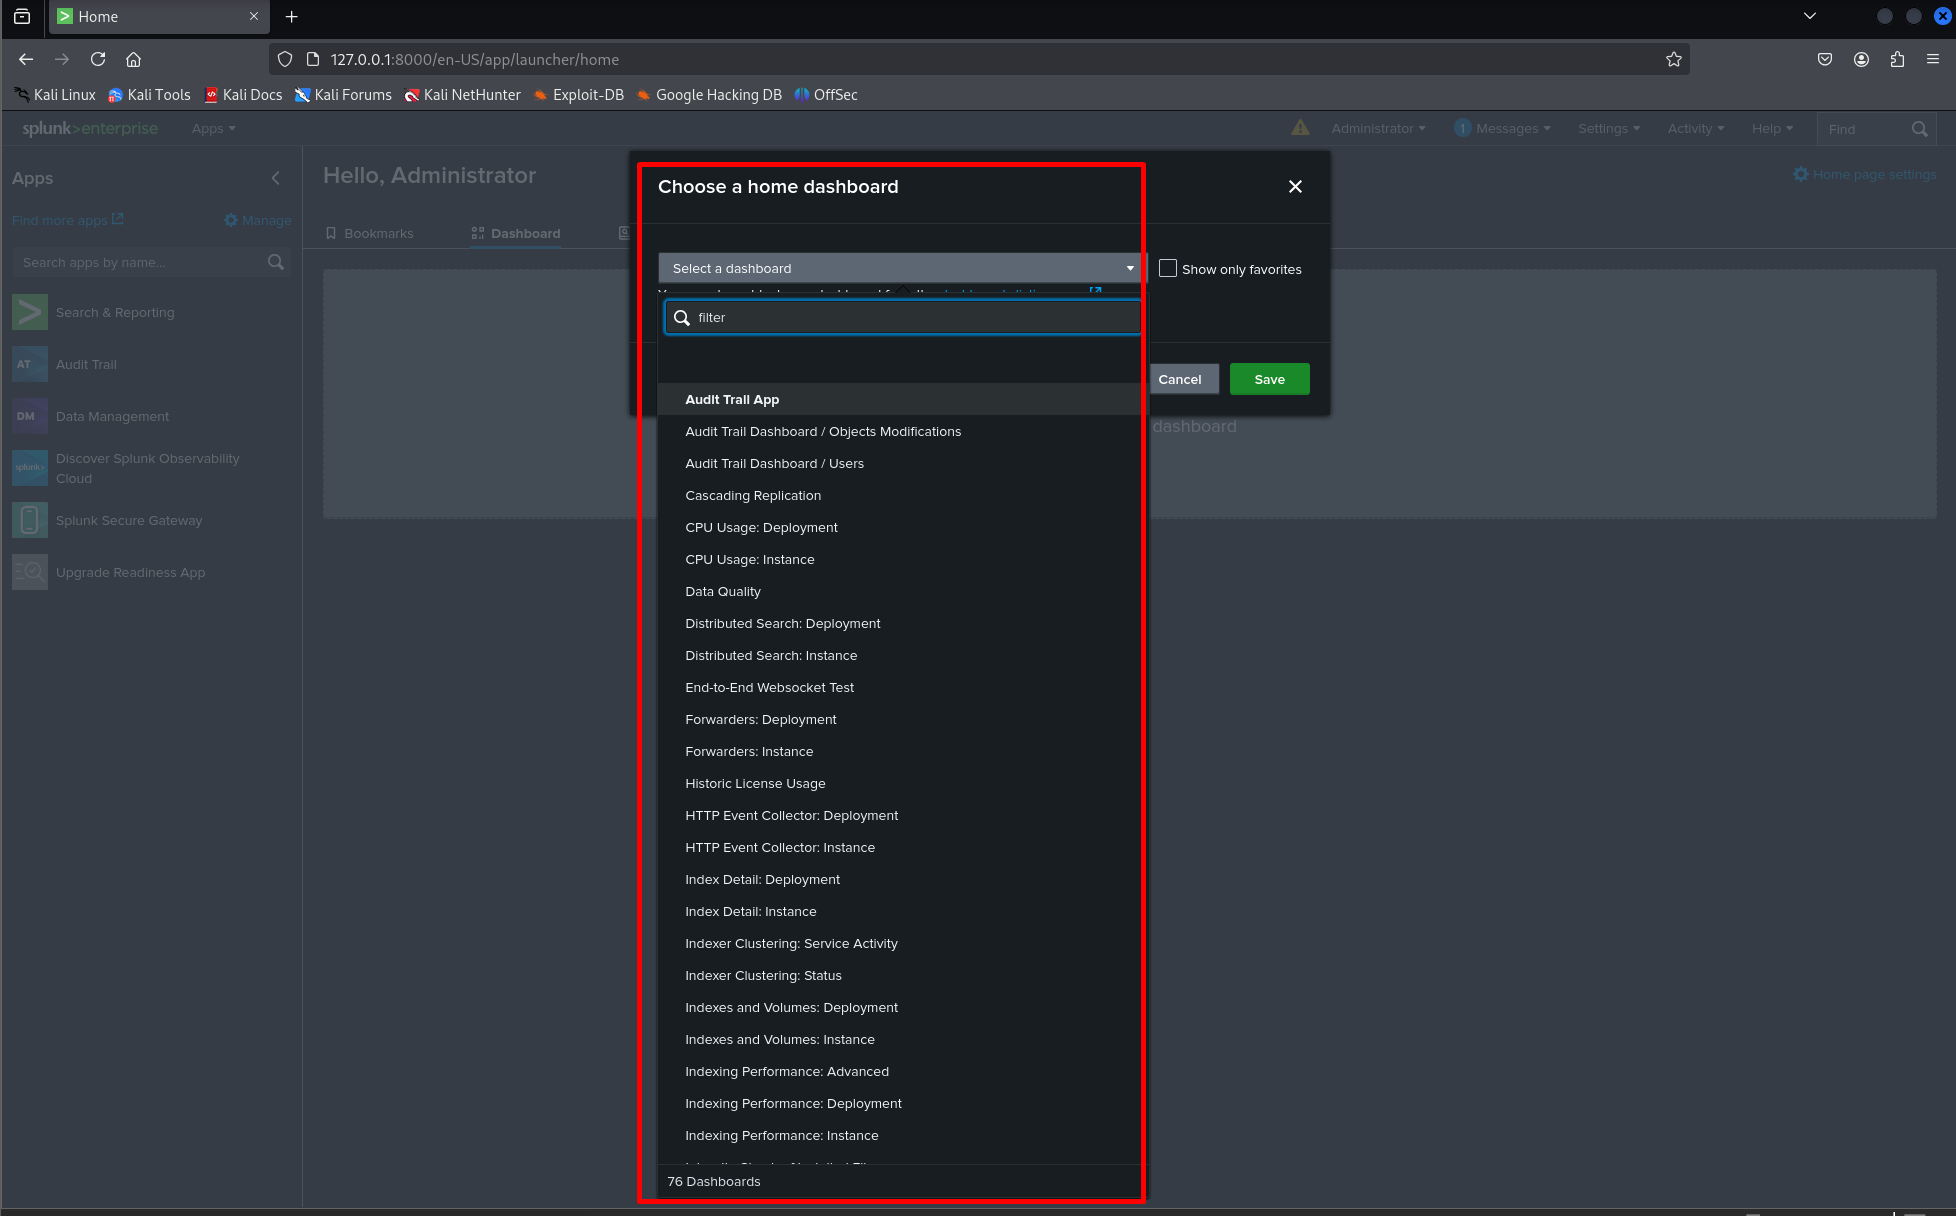
After logging in, confirm that Splunk is operational and ready to accept data.
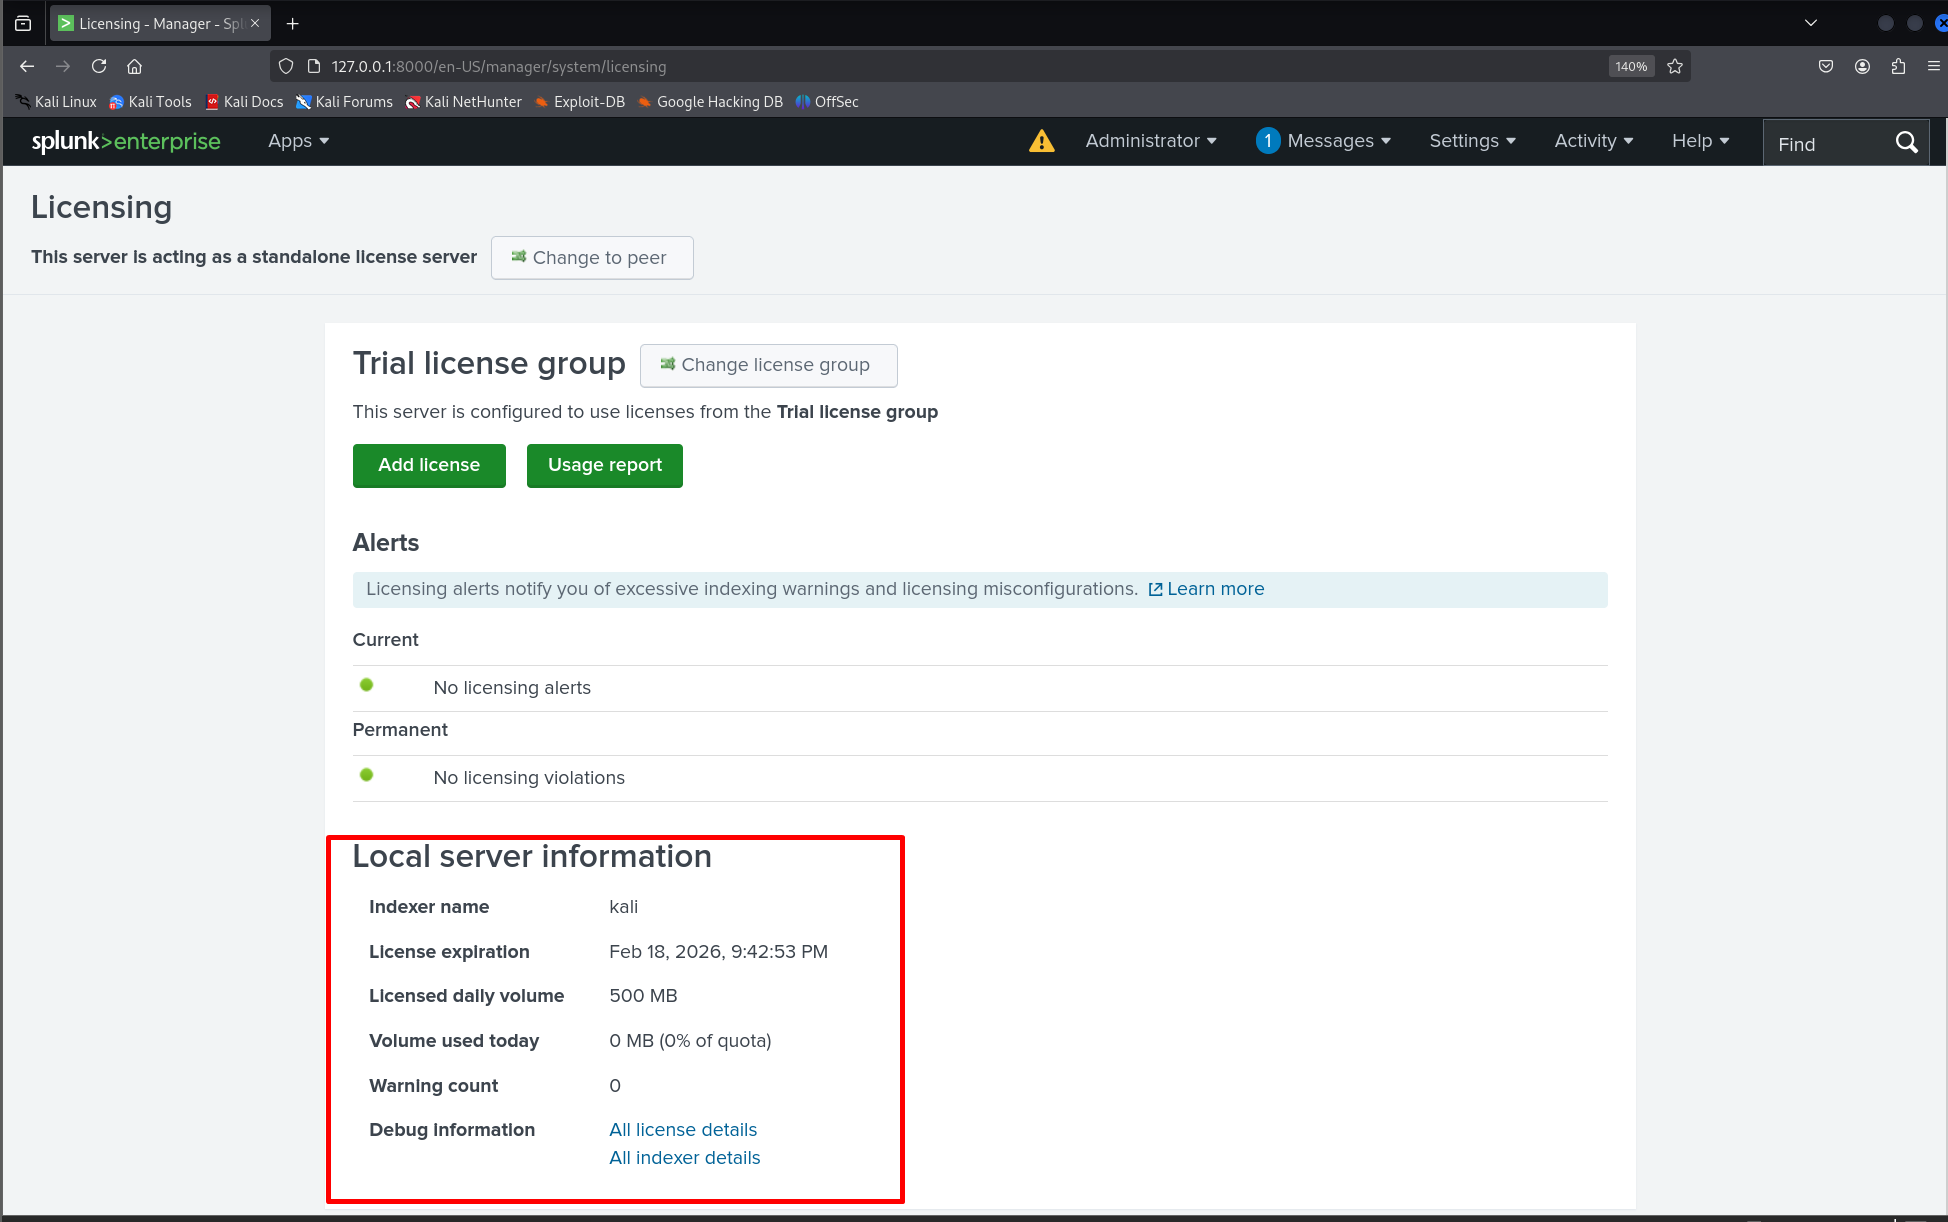
Navigate to: Settings → Licensing and verify your license status (Free or Trial in lab setups).
Check the internal logs to make sure indexing and internal processes are healthy:
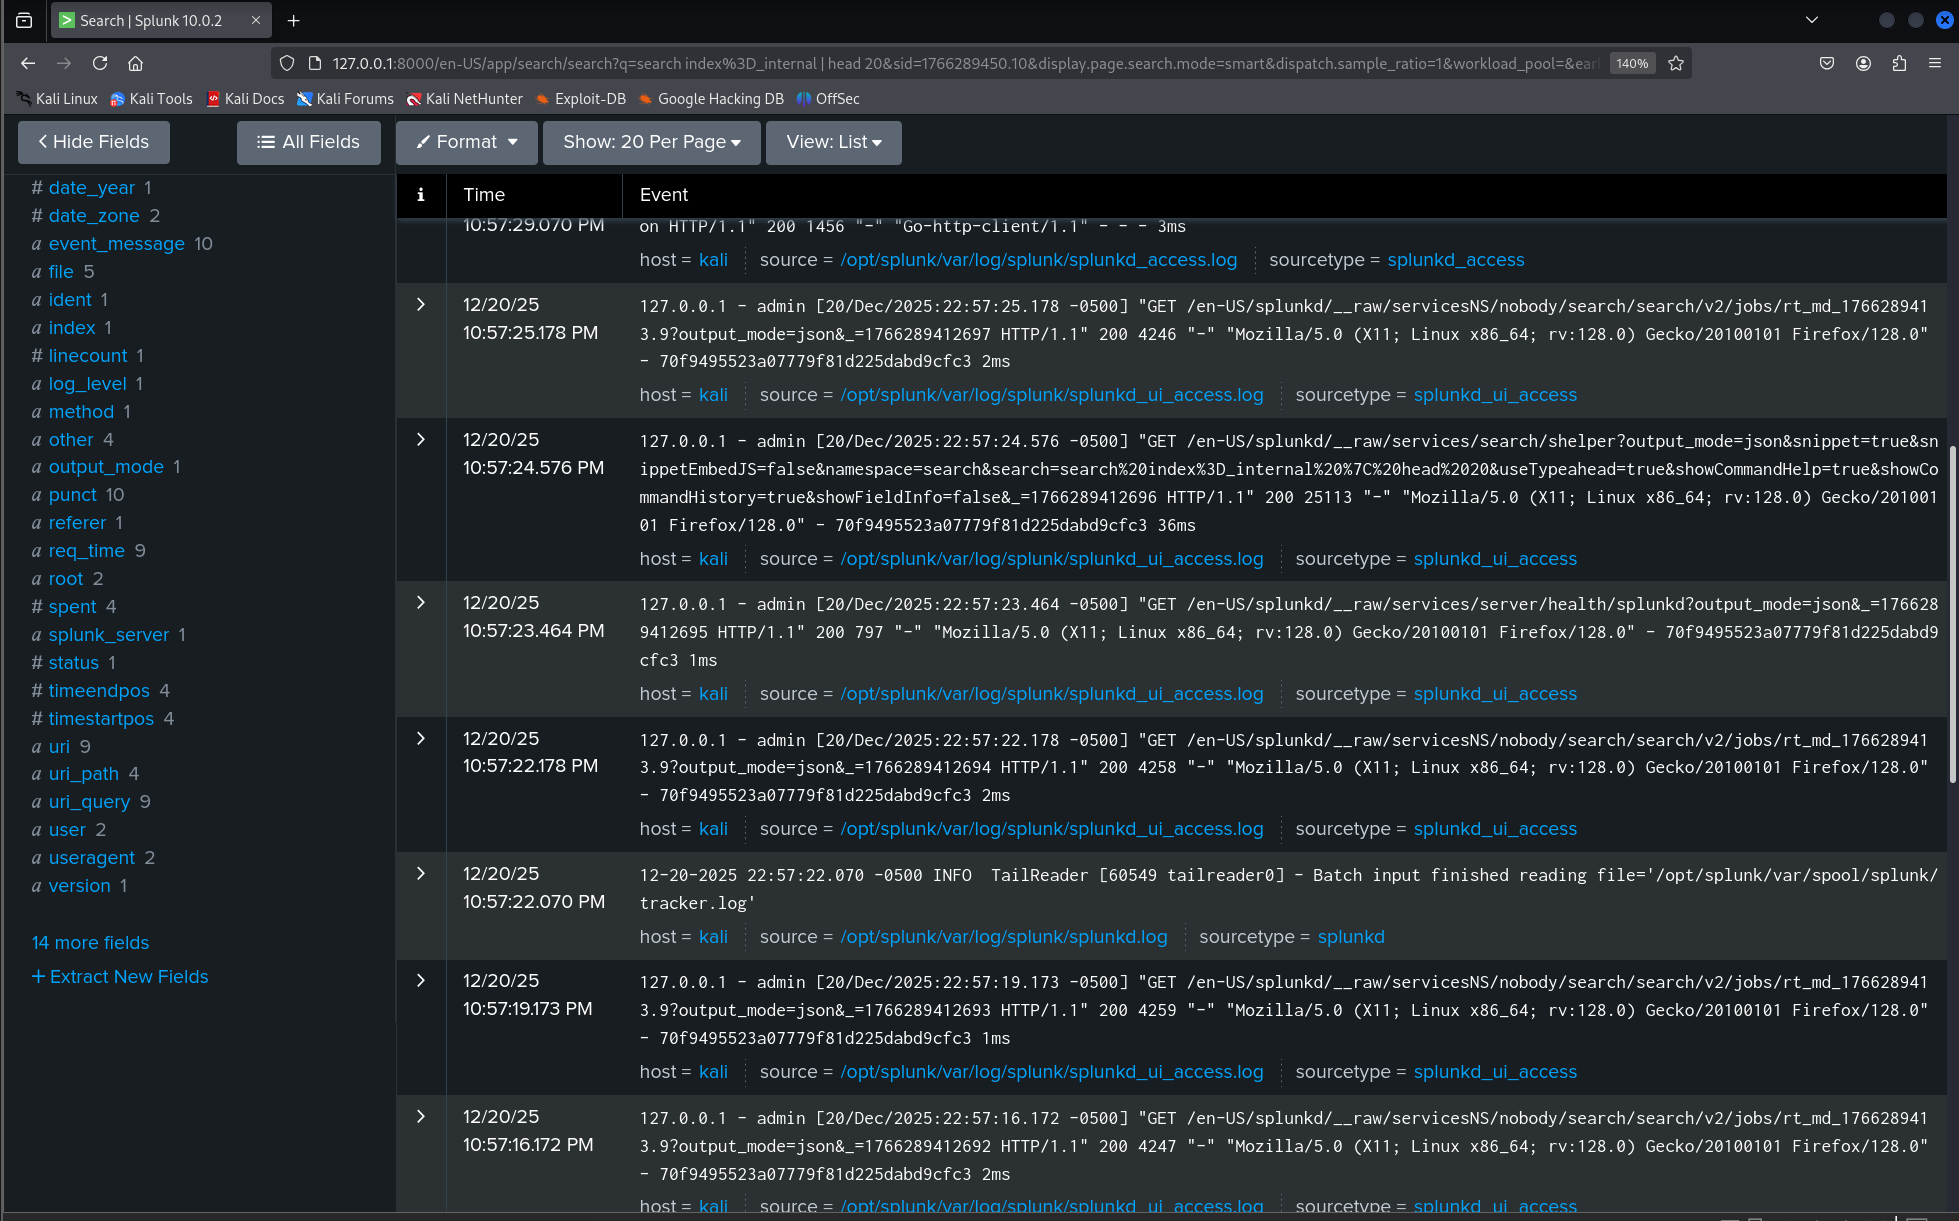
index=_internal | head 20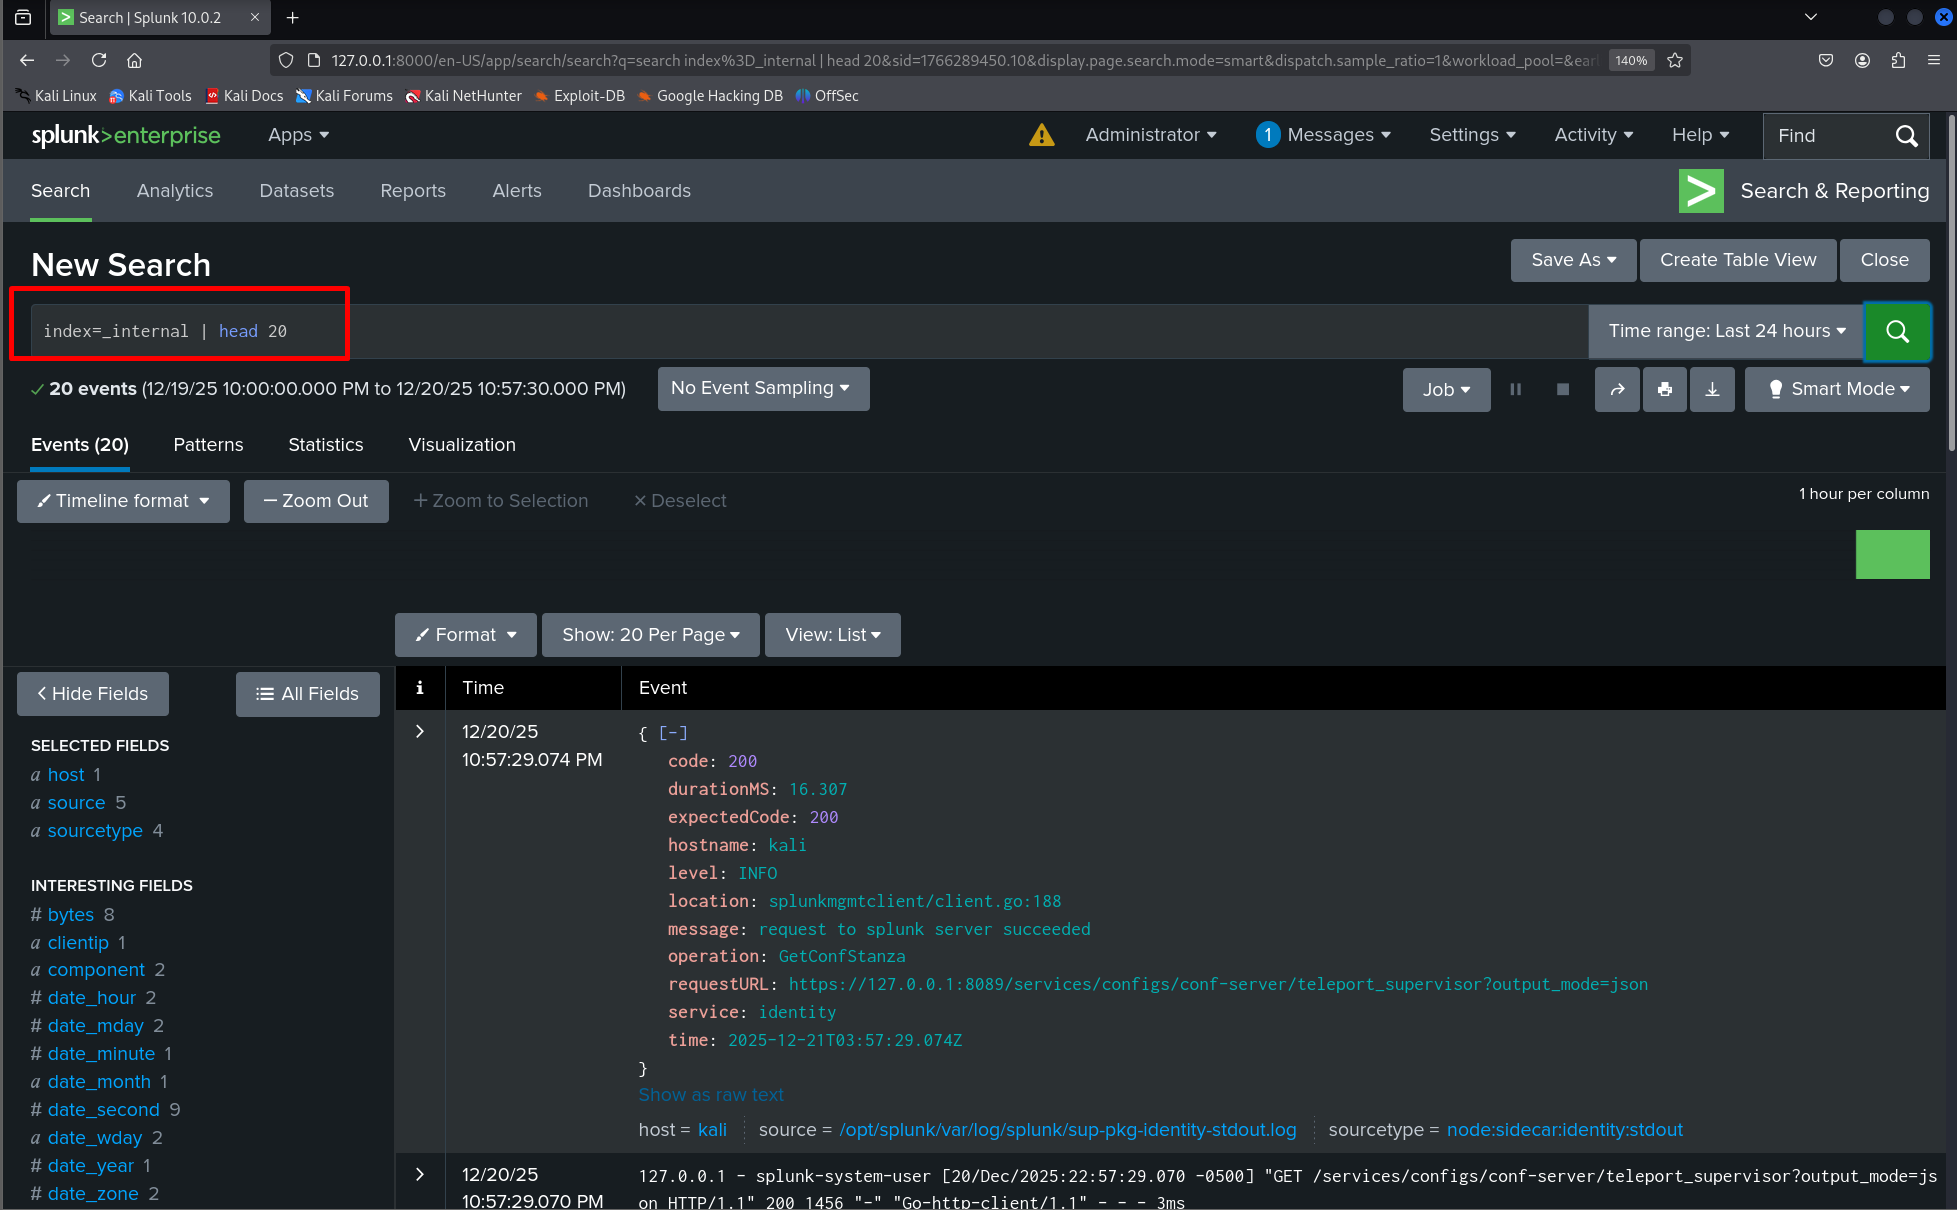
Note: Splunk offers a perpetual Free license after the 60-day trial for lab use (500 MB/day indexing limit). To switch, go to Settings → Licensing and follow the prompts to convert to the Free license when the trial ends. This is useful for ongoing lab work where full enterprise licensing is not required.
Introduction to SPL (Splunk Processing Language)
With Splunk running, the next step is learning how to search data using SPL. SPL is the language used to query, filter, and analyze events stored in Splunk.
Open Search & Reporting and run a basic search to confirm data and search functionality:
index=_internalThis returns events from Splunk’s internal logs and is useful for confirming searches are operational.
Basic SPL example — limiting results
index=_internal | head 20This command limits output to the first 20 events, making results easier to review.
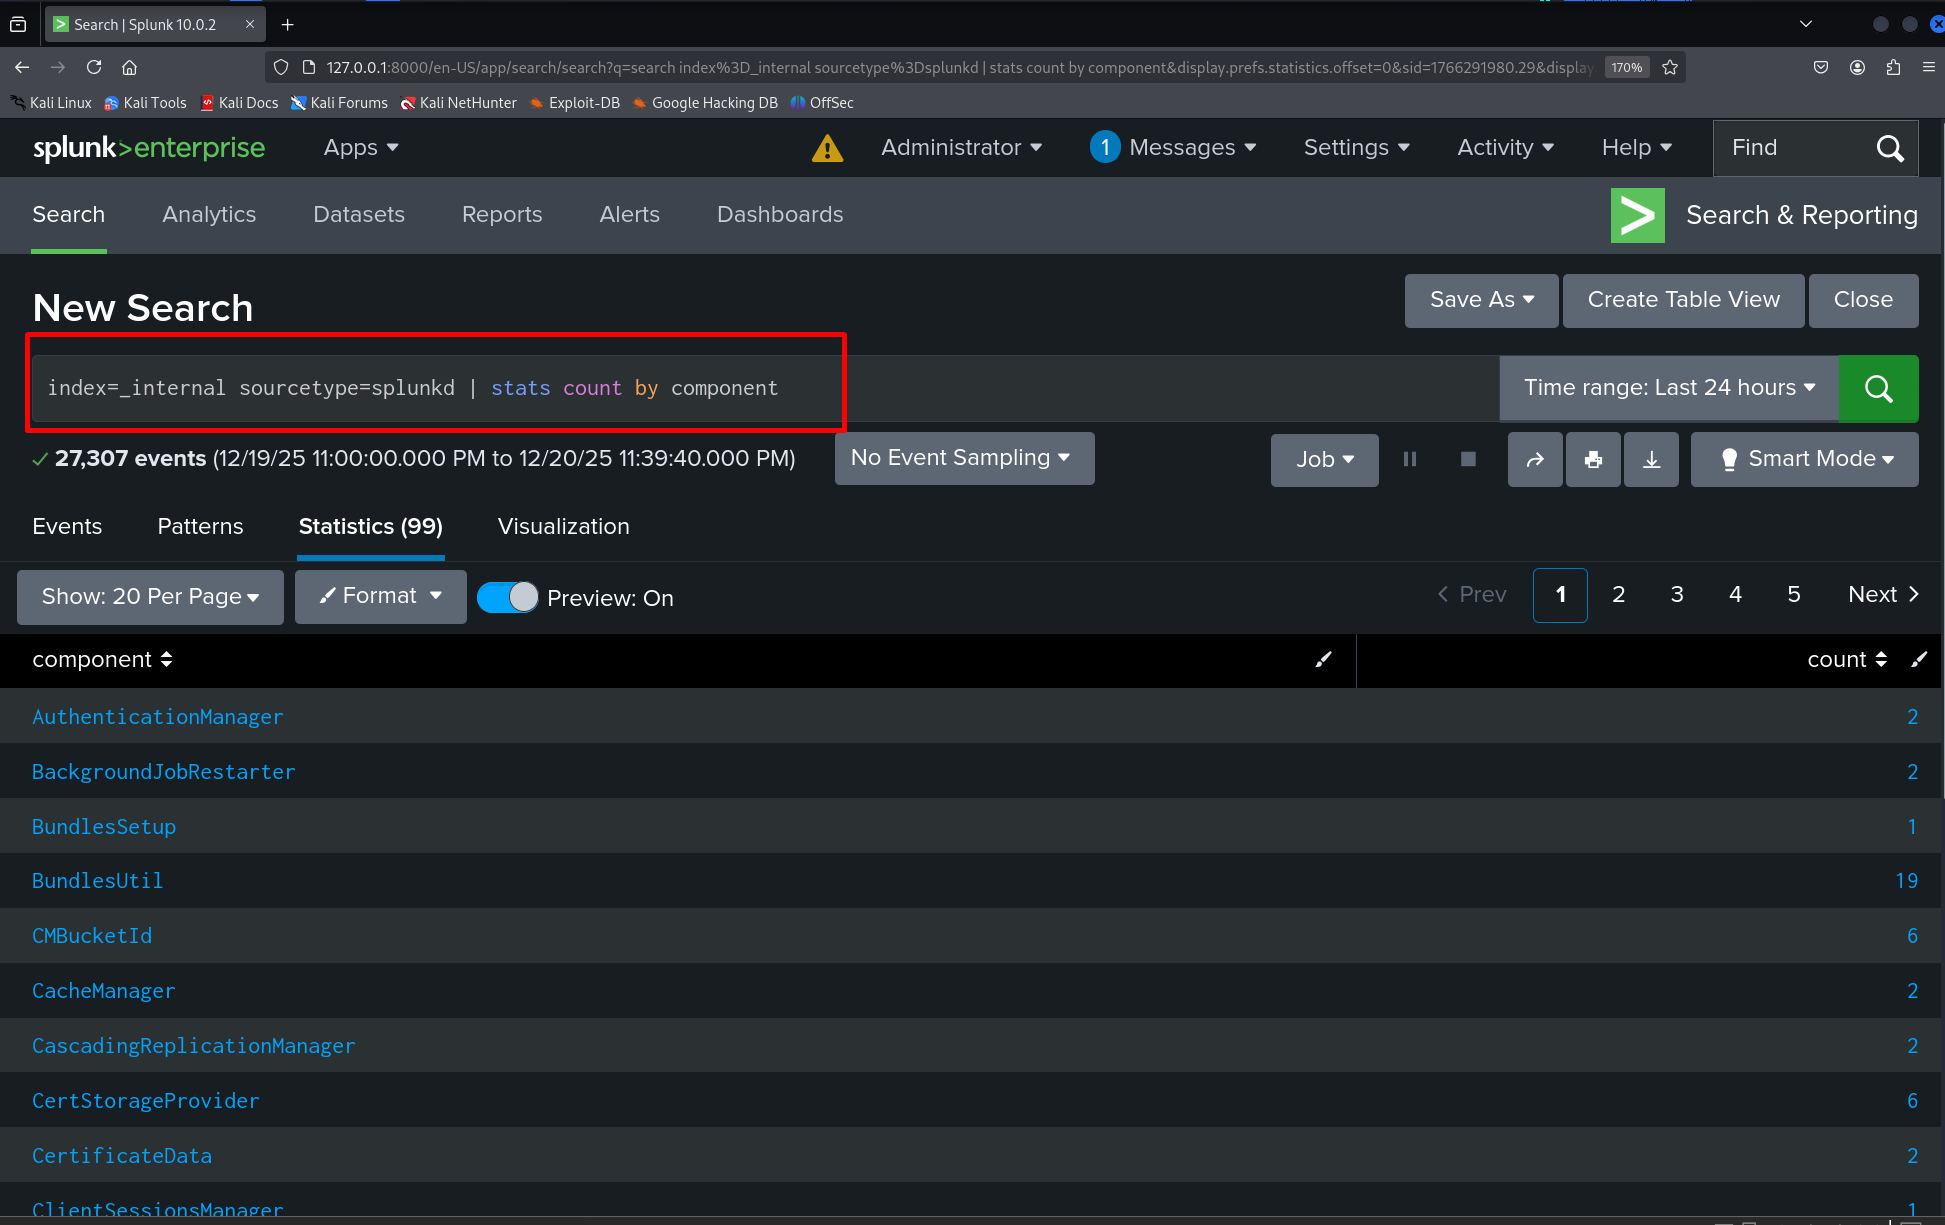
Basic SPL example — simple stats
index=_internal sourcetype=splunkd | stats count by componentThis shows a simple stats aggregation by component and helps illustrate how you can summarize internal event counts.
Why SPL Matters for Security Monitoring
SPL allows analysts to quickly locate suspicious activity, identify trends, and correlate events across systems. Even basic searches provide valuable insight into how logs are structured and how security events are detected. As you progress through this series, we will demonstrate how to translate common investigative questions into SPL and build small dashboards and alerts useful for security work.
This part set up Splunk and covered the basic searches you will rely on while learning how to map events to detections. The next parts in this mini-series will dive deeper into threat modeling and analytics:
Stay Curious!